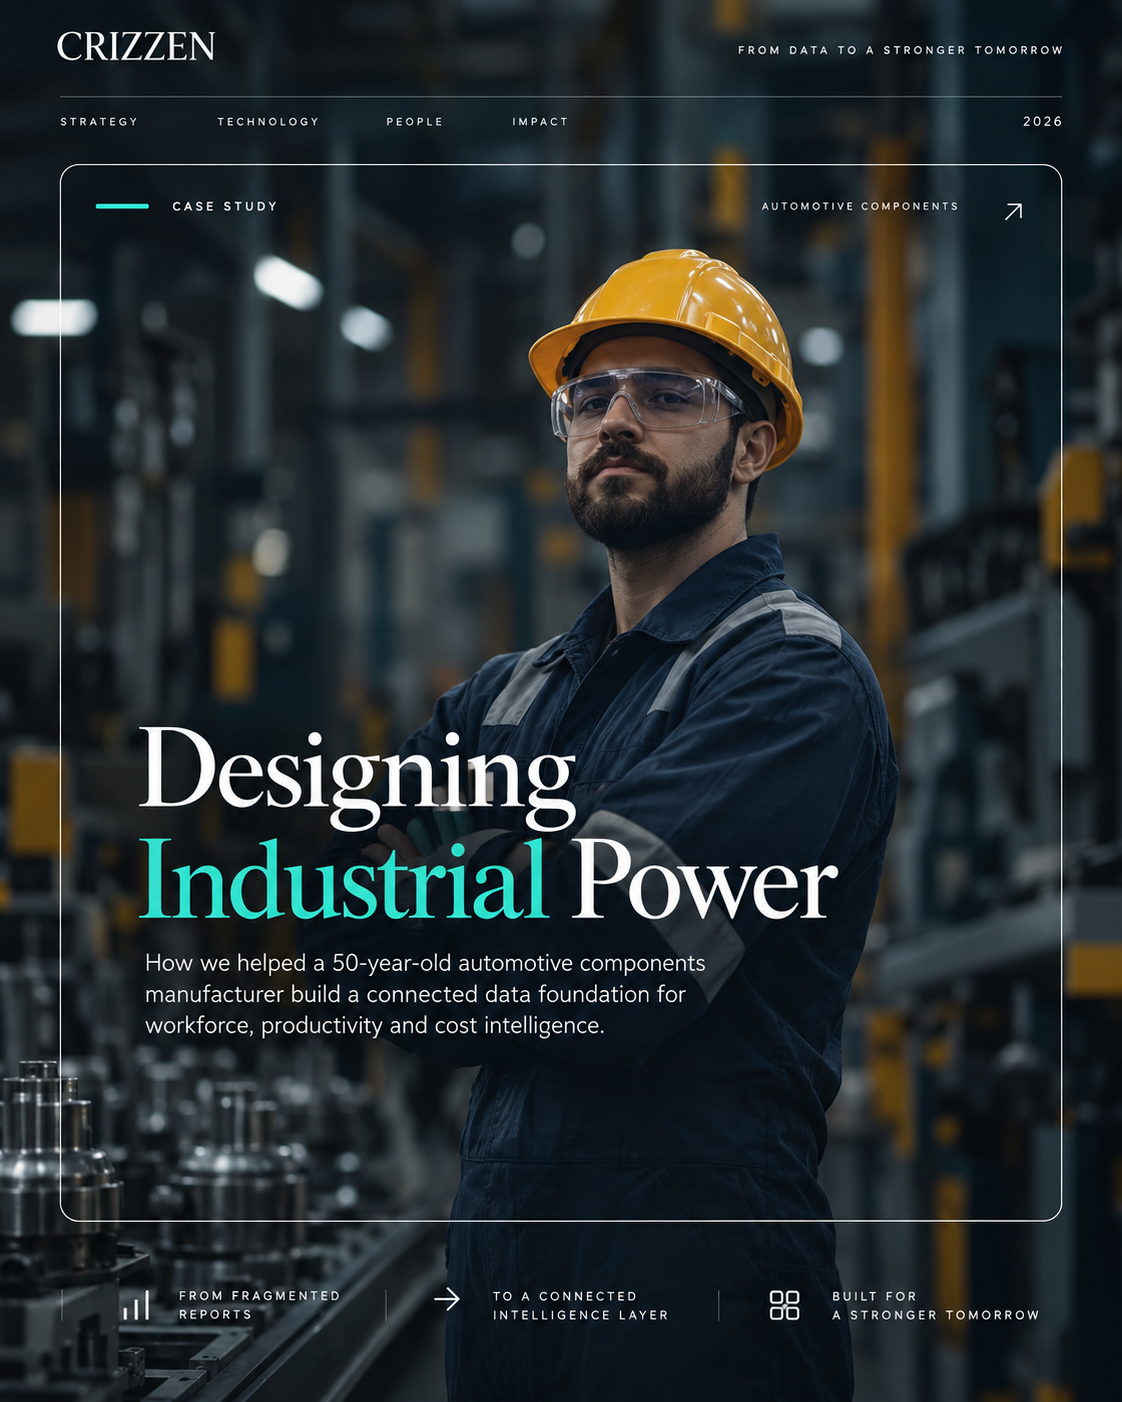
At this scale, workforce productivity management issues affect production, cost and daily operations, making it more than just an HR problem.
That was the problem we set out to solve.
They had the data, but it wasn’t providing the visibility.
The organization already had data across manpower, attendance, overtime, absenteeism, production and workforce costs. Although most of that data was in the form of excel spreadsheets uploads, manual MIS reporting and operational processes.
This created a problem where different teams were looking at different pieces of the picture.
- The Management wanted a consolidated view of performance across all plants.
- Plant teams needed shift and line level visibility for better workforce management.
- HR needed workforce and attendance intelligence oversight.
- Finance needed manpower cost-benefit visibility.
With all the data already available in silos, our challenge was to connect it in a way that allows the teams to interact with it and draw essential insights from it.
So we built around one question.
“How do we create one reliable operating picture for workforce productivity?”
We approached with our 4D Framework:
1. Discover: We established common KPI definitions, data ownership, business logic and governance.
2. Design: We built automated ingestion pipelines for existing data sources and brought workforce, production and cost information into a common data foundation.
3. Develop: We created a KPI and semantic layer so different teams could work from the same definitions and data.
4. Deploy: We built a role-based Workforce Management System with views for Management, Plant Heads, HR and Finance.
It brought together:
- Manpower & Cost
- Shift / Line Productivity
- Efficiency
- Trends & Insights
We created a common KPI and semantic layer so that different teams could work from the same definitions, business logic and operational context.
This foundation also made the AI layer more reliable. Instead of interpreting fragmented operational data independently, the conversational agent could work against standardized metrics and business definitions.
That meant a decision-maker could ask questions such as:
- “Why did productivity fall on this line?”
- “Which shifts are driving the overtime increase?”
- “Where is absenteeism having the greatest operational impact?”
- “What workforce cost anomalies need attention?”
The value of the conversational layer was not simply making the data easier to access. It gave decision-makers a way to explore the operating picture in the language of the business, while keeping the underlying metrics and definitions consistent.
The result was a workforce productivity command center.
The system connected the journey from “Data” to “Action” using “Artificial Intelligence” and “Attention” as the means. Instead of manually consolidating information across different sources, stakeholders could now work from a common operating picture tailored to their specific roles.
We then took the system through pilot rollout, training, SOP creation, bug resolution, performance optimization and handover.
Where we go from here
Our SCALE-AI framework moves through 5 stages:

The Command Center established the foundation, and the next step is making that intelligence increasingly conversational, actionable and embedded into everyday operations.
The organization already had the required data. It just needs a better way to connect it with the people making operational decisions. Our workforce command productivity center is built to address that gap.
A connected workforce intelligence layer that turns fragmented operational data into a clearer picture of what is happening, where attention is needed and where the organization can act.
If your organization has data spread across systems, spreadsheets and functions, the first question may not be which AI tool to deploy.
It may be how to turn what you already know into something your people can act on.
If that is a problem you are working through, write to us at info@crizzen.com.